In our previous content we have described “What is Amazon Brand Analytics & Why is it needed?” If you missed that content please take quick look from this link.
In today’s content we have described which reports provide Amazon Brand Analytics and how you will be benefited from that data.

Which reports provide Amazon Brand Analytics?
The following reports are accessible to brand owners. Data is typically available in brand analytics 72 hours after the end of a particular period.

- Amazon’s search terms report
After going to the brand analytics page, you will see the amazon search term report.
From this search term report, you can see how people are searching for their products and those of competitors on amazon. The information contains each product’s click-through rate, conversion share, and search popularity.
Here’s a quick rundown of some of the important components you’ll see in the amazon search Terms report.
- Most popular amazon search terms during a certain time period.
- The search frequency rank of a search term/keyword.
- Top three products clicked by customers after searching for a term.
- The conversion rate and click-share of the top three products.
- Clicked ASINs.
- Product titles.
Search Term:
Amazon search terms are keyword strings that a shopper types into Amazon search to find a product.
Search frequency rank:
The search frequency rank is the numerical rank of a specific search phrase based on its popularity during a specific time period.
Click share:
Click share is calculated as the number of times customers clicked on a particular product in response to a search phrase divided by the total number of times customers clicked on all products.
Conversion Share:
Conversion share is calculated as the number of times customers bought a certain product for a search term divided by the total number of times customers bought products for searches.
Clicked ASINs:
This column refers to the specific ASIN that, following a keyword search on Amazon, garnered the most clicks from customers.
Product Title:
It is, as the name says, the title of the product in relation to the clicked ASIN.

- Market Basket Report
An investigation of the market basket will show you which goods your clients are bringing with them when they purchase your product.
Purchased ASIN: The ASIN that is most frequently purchased with your product is referred to as the purchased ASIN.
Purchased Title: Name of the purchased product.
Combination: When compared to the total number of orders with these two ASINs stated separately, it shows the percentage of orders that also include your product.

- Repeat purchase behavior report
The Repeat Purchase Behavior report provides brand owners with information on the number of orders placed for each of their goods or brands as well as the number of distinct clients that did so.

- Item comparison report
The item comparison report displays the items that amazon shoppers on the same day as your products most frequently viewed. You can learn which products are directly competing with one another in this way.
- Alternate purchase report
You can compare your products to other products in the Alternate Purchase behavior report. Your products are shown with 5 more products respectively. You may observe how frequently a particular product was chosen over your own within a 24-hour period for these products.
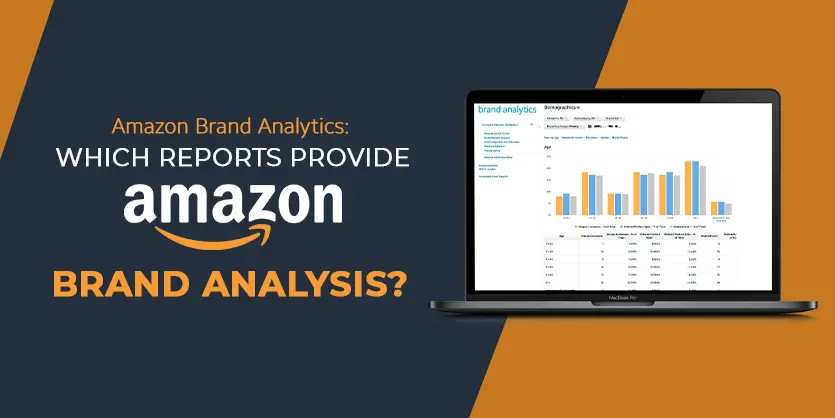
- Demographics report
Demographics is the final category in the amazon brand analytics. Demographics will assist you in providing useful insights into your target audience.
The demographics section provides a detailed breakdown of customer and sales statistics based on variables such as age, family income, gender, marital status, and education. Let’s examine them carefully.
Number of consumers who placed orders in a certain time period who were unique customers.
- Unique customers% of total – This one is apparent.
- Sales of goods that were ordered but returned have been corrected.
- Number of units that your consumers have ordered from you on Amazon.
- Search query performance dashboard
Based on customer search activity, the query performance dashboard offers visibility into the performance of the key search phrases connected with your brand. The report displays the number of queries, views, clicks, adds to carts, and transactions.
You may improve your listings (including A+ content) by incorporating keywords that correspond with customer interests by analyzing how buyers are finding your products. This information can also be used to identify patterns that could indicate chances for new products.
- Search catalog performance dashboard
The search catalog performance dashboard offers metrics on how customers engage with your products as they search and shop for them. Search impressions, clicks, add-to-cart actions, and purchases are some of these metrics.
- Conclusion
Finally we can say that, One of the better reporting tools available in Seller Central right now is the Amazon Brand Analytics tool. You can use it and all of the reports will be helpful for you.
Please leave a comment if you have any questions about this article. We’re available to help you at all times. We will provide additional information about the Amazon Brand Analytics Tool. Please visit our website and follow us to stay connected.