
This article will focus on discussing Amazon Benchmark Report and will show you how to download it and how to get benefit from it. It also discusses Category Benchmarks for Sponsored Brands.
Now Amazon sellers can download the Category Benchmark Report. They can get the idea of where they are standing and also can compare their peers. Using this information, sellers can improve their ad performance on Amazon. It shows impressions, click-through rate (CTR), return on ad spend (ROAS), and advertising cost of sales (ACoS) compared with their closest peers’ performance values. You will see your closest peers’ performance values at the median, lower-performing quartile (bottom 25%), and top-performing quartile (top 25%) within specific shopping categories.
Analyzing the performance, you can better understand the performance changes impact by your campaign optimizations or category trends.
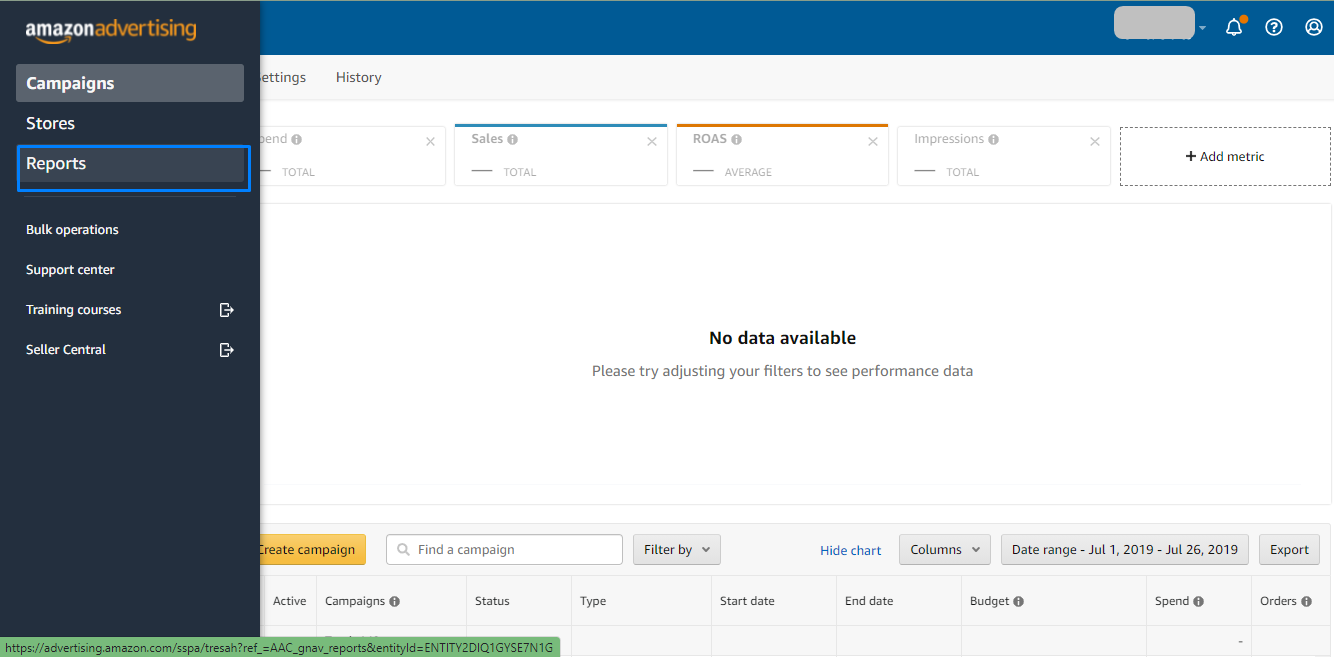
Go to Amazon advertising, click on Reports.
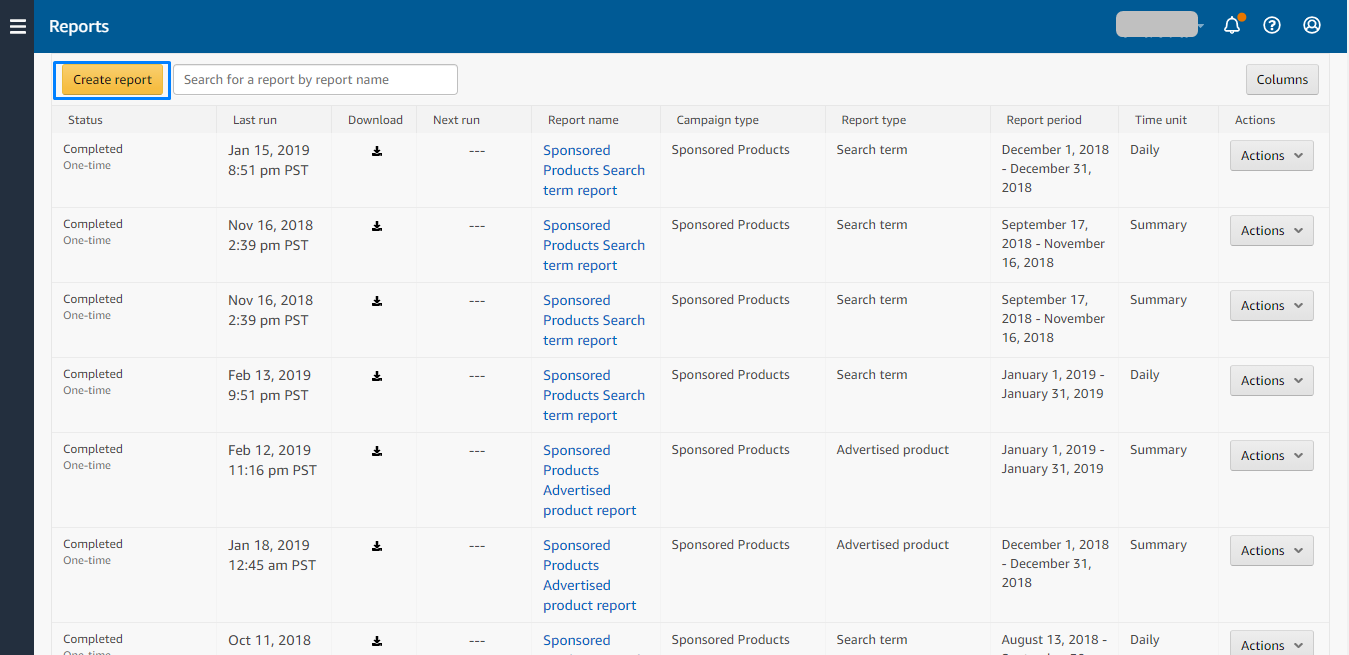
Click on Create Report.
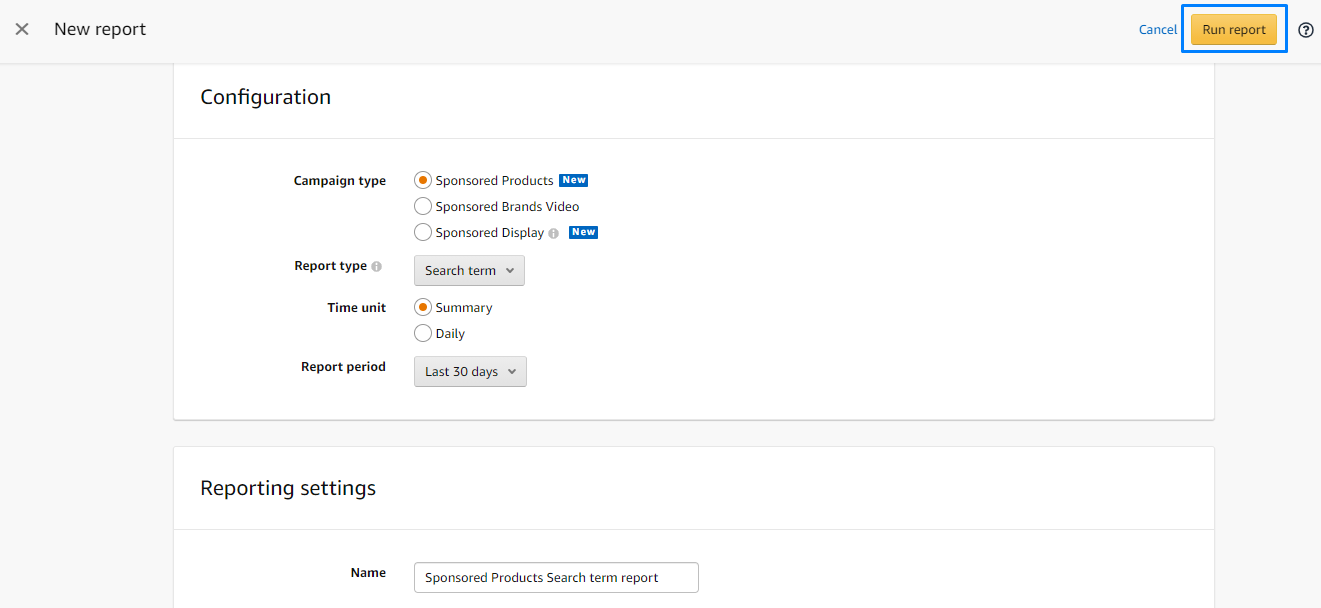
Select the report you want. Click on Run Report to download the report.
Impressions
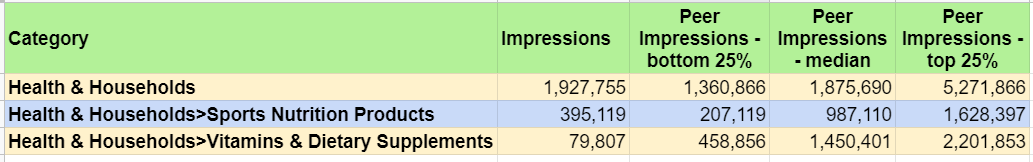
You will find here Peer Impressions – bottom 25%, Peer Impressions – median, and Peer Impressions – top 25%.
Say you are 11 sellers selling a category and if you arrange all your received impressions in ascending order, the median here corresponds to the midpoint. 6 represents the median, seller at position 3 the bottom 25% peer and 9 the top 25% peer.
1 2 3 4 5 6 7 8 9 10 11
We have presented a sample below where our brand received 1,927,755 impressions for the Health & Households Category. We do not know how many competitors are existing. But we know the median received 1,875,690 impressions for Health & Households. This means that our brand is receiving more than half of our competitors but less than the 25% quartile. It is hard to guess how many impressions the top peer is receiving but it is not less than 5,271,866.
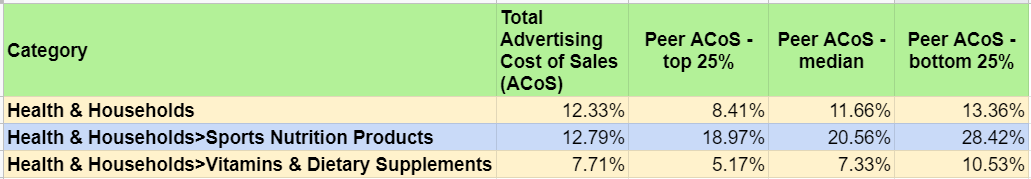
ACoS
Our data about ACoS seems interesting, here it is easy to see how the above and below advertisers are doing. Our Sports Nutrition Products is the best category for this brand to advertise because they are extremely profitable. It is much better than the bottom 25% peer.
Instructions:
If you find your impressions are more than the median or top 25% peer, then you need to concentrate on that category to have a profitable business. If you think impressions are enough but CTR is low then improve the message on your ads to receive the buyer’s attention. For your poor ACoS, you need to lower your bids to a level so that you can also have a reasonable profit. For low impressions increase the bids and budgets and take the advantages of your ad quality.
The Brand Category Benchmark is an important tool to develop your business strategy. It will help you to create profitable ads and to minimize the cost of your advertisement. Download your report and let us know how you are doing. Please do not forget to share your opinions with us, stay connected to stay updated.